Get your free personalized podcast brief
We scan new podcasts and send you the top 5 insights daily.
A GMO study from 1957-2023 found the top 10 S&P 500 stocks underperformed the remaining 490 by 2.4% annually. The last decade's outperformance by mega-caps is a significant departure from this long-term trend, suggesting a potential reversion to the mean.

Related Insights
Goldman Sachs forecasts low long-term S&P 500 returns (3-6.5% annually). The key reason is that today's high market concentration implies higher future volatility, yet investors aren't being compensated for this risk because current valuations are already historically high and likely to contract.
The S&P 500's historical earnings growth is ~6.7%. The ~9% growth of the last decade was an exception, driven by the unprecedented hyper-growth of a few mega-cap tech firms. As the law of large numbers catches up to these giants, investors should anticipate future index returns to revert to historical, lower norms.

The perception of a market rally driven solely by a few tech stocks is misleading. The S&P 500 excluding the top 10 companies has seen strong earnings growth and consistent ~15% annual returns for the past three years, indicating broad market health.

The performance gap between market-cap and equal-weight strategies is not random; it's cyclical and can last for over a decade. While market-cap has dominated recently (winning 8 of the last 11 years), this was preceded by a period where equal-weight won for 13 of the prior 15 years. Recognizing these long cycles is crucial for strategic allocation.

The underperformance of active managers in the last decade wasn't just due to the rise of indexing. The historic run of a few mega-cap tech stocks created a market-cap-weighted index that was statistically almost impossible to beat without owning those specific names, leading to lower active share and alpha dispersion.

The current market is not a simple large-cap story. Since 2015, the S&P 100 has massively outperformed the S&P 500. Within that, the Magnificent 7 have doubled the performance of the other 93 stocks, indicating extreme market concentration rather than a broad-based rally in large companies.

Contrary to the belief that only a few mega-cap stocks drive market returns, a significant portion of S&P 500 companies—167 in the year of recording—outperform the index. This suggests that beating the market through stock picking is more attainable than commonly portrayed.

When markets are top-heavy and expensive, like in 2000, the concentration risk of market-cap weighting is severe. In the 13 years after the dot-com peak, while the S&P 500 went nowhere, its equal-weighted version doubled, highlighting a powerful de-risking strategy.
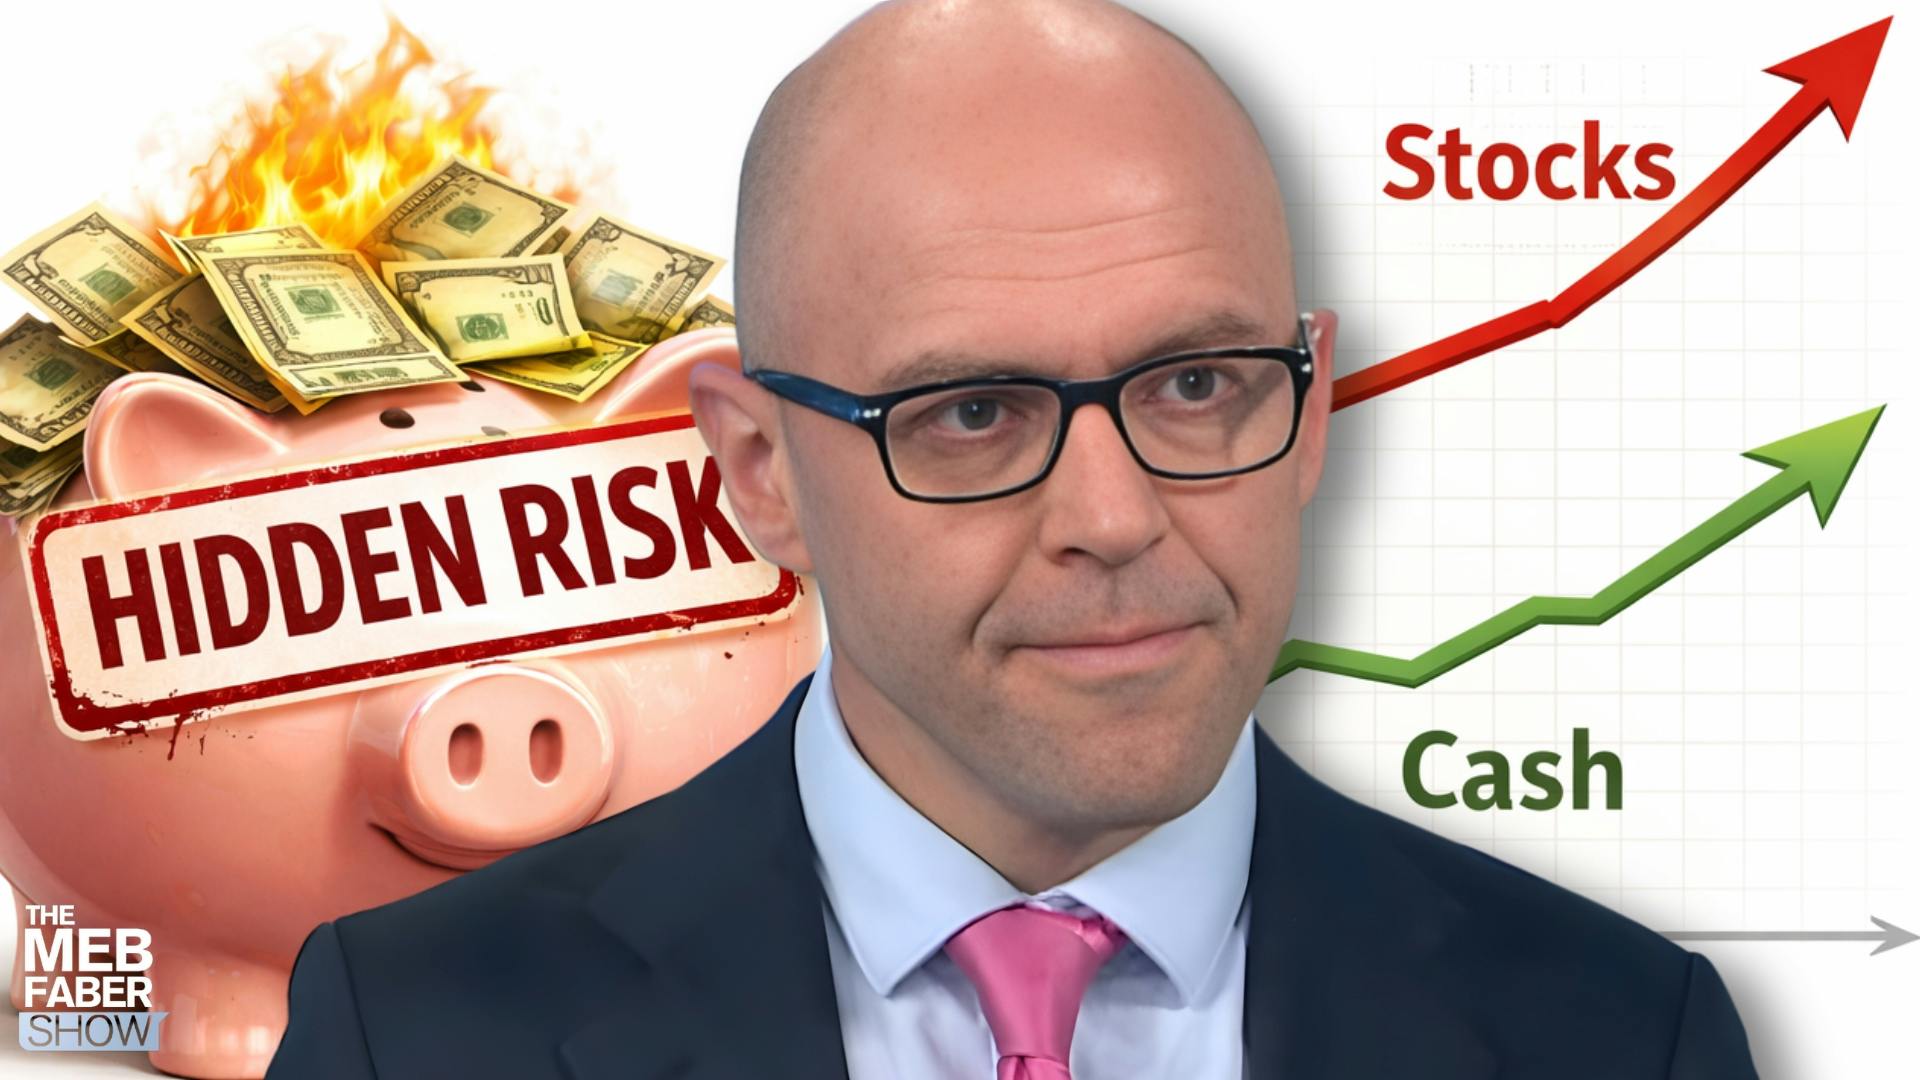
Market-cap weighting turned the S&P 500 into a momentum fund for megacaps, leading to a decade of outperformance versus its equal-weight counterpart—a historical anomaly. Recent signs of equal-weight taking the lead suggest a potential market regime shift back towards value and smaller companies.

While indexing made competition tougher, the true headwind for active managers was the unprecedented, concentrated performance of a few tech giants. Not owning them was statistically devastating, while owning them reduced active share, creating a no-win scenario for many funds.